 RefreshRank
Average Position Dropping in Search Console? What It Means
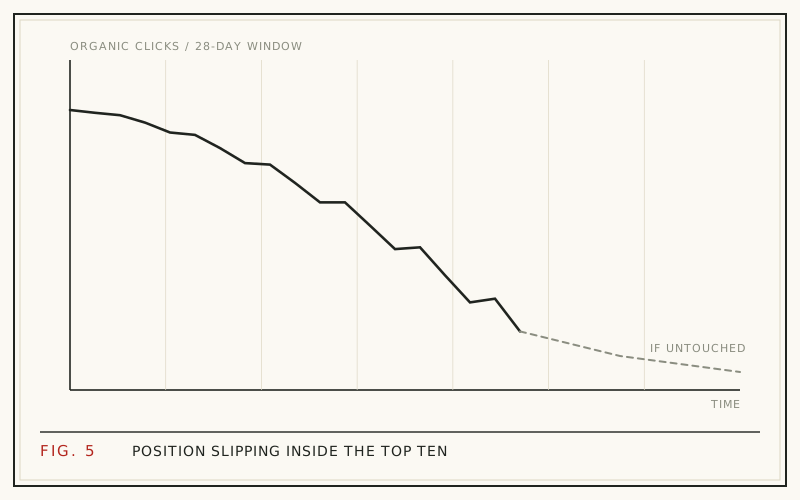
A dropping average position in Search Console does not automatically mean your rankings fell. The metric is impression-weighted: every impression for every query pulls the average around, so a page that starts appearing for new low-ranking queries will show a worse average position even while its core rankings and its clicks hold perfectly steady.
That makes average position the most misread number in Search Console. Sometimes a drop is growth in disguise; sometimes it is genuine decay. This guide covers how the metric is actually calculated, the benign causes of a falling average, the real ones, and a five-minute diagnostic that tells them apart before you change anything.
How Google calculates average position
For every impression, Google records the topmost position at which your result appeared for that query. Average position is the mean of those values across all impressions in the date range - nothing more sophisticated than that.
Two properties of this definition cause most of the confusion. First, it is an average over impressions, not over queries: a query that shows your page 10,000 times influences the number a hundred times more than a query that shows it 100 times. Second, only served impressions count - rankings that never appear in front of a searcher contribute nothing. The metric can therefore move sharply without a single ranking actually changing.
Why average position drops when a page grows
Imagine a page with 1,000 impressions at position 3. Its average position is 3.0. Now Google starts testing it for a big adjacent query at position 45, adding 1,000 new impressions. The average becomes 24 - an alarming chart - while the original ranking is untouched and clicks may even be rising.
This happens constantly to improving content. New impressions almost always arrive at low positions first, because that is where Google trials a page against unfamiliar queries. Expanding visibility mathematically drags the average down. A falling average paired with rising impressions is usually a good sign, not a bad one.
Benign causes of a dropping average
Run through this list before assuming anything is wrong.
- Query expansion: the page begins appearing for new, lower-ranked queries, dragging the average down while core terms hold steady.
- New pages: at the property level, every fresh post starts near the back of the results and lowers the site-wide average. A growing site almost always shows a "worsening" average position.
- New countries or devices: impressions from markets where you rank worse get mixed into the blend. Check the Country and Device filters before panicking.
- Search type mix: the default view is web search; switching or comparing across Image, Video, or News changes the math entirely.
If any of these fits, the drop needs no action at all. It is arithmetic, not decay.
Causes that are real ranking losses
Sometimes the average drops because rankings genuinely fell. The usual suspects: a competitor refreshed their page and overtook you, an algorithm update reshuffled the SERP, or the page is aging out of relevance - the pattern we call content decay.
Background movement never stops. Google reports running 719,326 search quality tests in 2023, which produced 4,781 launched changes (Google, 2023). Most are invisible; the confirmed named updates - four in 2025, per Search Engine Land's year-end review (Search Engine Land, 2025) - are simply the largest waves. A steady per-query position loss that persists through one of these periods is decay or displacement, not measurement noise.
The five-minute diagnostic: filter to core queries
Average position only becomes meaningful once you pin it to specific queries. The check:
- Open Performance -> Search results and set a comparison: the last 28 days against the previous 28, or year over year for anything seasonal.
- Filter to the page you are worried about, then open the Queries tab.
- Read the position column for the five to ten queries that drive most of that page's clicks.
- Ignore everything ranked past position 20 for now - those are trials, not traffic.
If the core queries held their positions, the average drop is dilution and you are done. If the core queries slipped, you have a real loss with a measurable size, and the next question is what it is costing you in clicks.
Read position together with clicks and CTR
The metrics diagnose together what none of them can alone:
| Position | Clicks | Likely cause | What to do |
|---|---|---|---|
| Down | Steady or up | New low-ranked impressions diluting the average | Nothing - this is growth |
| Down | Down | Ranking loss on core queries | Refresh the page |
| Steady | Down | Snippet losing appeal | Fix the title and CTR |
| Down site-wide | Down site-wide | Algorithm update or technical issue | Run the full diagnostic |
The second row is the one that deserves real attention, and even then only when the decline persists across a full window rather than a bad few days.
Why small position drops cost outsized clicks
Position changes near the top of the page are disproportionately expensive. In Backlinko's analysis of 4 million search results, position 1 earned a 27.6% average organic CTR against 2.0% at position 10 (Backlinko, 2025). The same study found that moving up one position lifts CTR by 32.3% on average, and that the move from position 2 to position 1 alone is worth 74.5% more clicks (Backlinko, 2025).
Read in reverse, that is the price of decay: a page slipping from 1 to 2 hands that 74.5% advantage to whoever replaced it, while the blended average-position chart barely twitches. A slide from 8 to 12 - off the classic first page - is often close to a total loss. Small numbers, large stakes.
Judge trends over full 28-day windows
Position data is noisy day to day: personalization, location, device mix, and Google's continuous testing all jiggle it. Judge trends over 28-day windows, so each window holds exactly four of every weekday, and compare year over year when the topic has any seasonal shape - demand changes SERP composition, and positions can shift with it. The mechanics of setting up these comparisons are in our Search Console walkthrough, and telling decay from seasonality has its own guide.
One more habit worth keeping: log the dates of your own site changes. A position drop that starts the week you switched themes or restructured URLs is a different investigation entirely.
When a position drop deserves action
Act when all three of these hold:
- A core query - one that actually drives clicks - fell, not just the blended average.
- The fall is material: from page 1 toward page 2, or several spots within the top 10.
- It has persisted across a full 28-day window.
A slide within the top three deserves the fastest response, because that is where the click curve is steepest. A wobble between positions 35 and 42 deserves none; nobody was clicking either way. Between those poles, weigh the clicks at stake against everything else on your refresh list.
What acting on it looks like
For a decaying page, the response is a scoped refresh: move the title and meta description toward the queries that slipped, rewrite the introduction to answer the searcher's question directly, and correct anything dated. The full sequence is in how to refresh old blog posts.
If you would rather not run the query-level diagnostic by hand every month, this is the job RefreshRank does: it reads your site's own Search Console history in 28-day windows, scores each page's decline from 0 to 100, sorts the queue by win-back Potential, and drafts scoped rewrites you review as current-vs-proposed diffs - nothing is ever published without your approval. Detection is free on one site via the WordPress plugin.
Questions
Is average position a ranking factor?
No. It is a reporting metric - a summary of where your pages appeared for the impressions they received. Google does not feed your Search Console charts back into ranking. Changing how you filter or read the number has no effect on rankings; it only changes how well you understand them, which is the point.
Why is my average position different from what I see when I search?
Your own searches are personalized by location, language, device, and history, and you are a single data point. Search Console averages every impression across all users, countries, and devices in the range. A page can show at position 4 on your screen and average 9.3 in the report because most impressions happen in contexts unlike yours. Trust the aggregate, not the spot check.
Do featured snippets and other SERP features count in average position?
Yes. Search Console records the topmost slot your result occupied, and results inside features are counted in that numbering - a featured snippet, for example, reports as position 1. This means winning or losing a feature can move your average position noticeably without any change in your classic organic ranking underneath it.
Can average position improve while traffic falls?
Yes, and it is a classic trap. If a page stops appearing for competitive queries where it ranked poorly, those low-position impressions leave the average, and the number improves while impressions and clicks shrink. Always read position alongside impressions and clicks; a prettier average on falling volume is usually a contraction, not a win.
Should I track position per page or per query?
Per query-page pair, for the handful of queries that drive each important page's clicks. Site-wide averages are diluted by every new post and every long-tail trial, and even per-page averages blend dozens of queries with different stakes. The core-query view is the only one stable enough to act on with confidence.
How long should I wait before reacting to a position drop?
One full 28-day window at minimum. Day-to-day movement is dominated by personalization and Google's continuous experimentation, which never pauses. If a core query is still down after a complete window - and further down than any seasonal pattern explains - treat the loss as real and schedule a refresh for the page.
What is a good average position?
There is no meaningful site-wide target. A large site's blended average includes every experiment and every new post, so 25 can be healthy and 8 can be terrible. The useful question is per query: for the queries a page should own, the top 3 is the goal, because the click curve collapses quickly below it.
Will refreshing a page restore its old position?
Sometimes, and nobody can honestly guarantee it. A refresh improves your odds when the page lost ground to fresher competitors on queries it still matches. It cannot recover positions lost to an intent shift or to vanishing demand. Measure the outcome the same way you found the problem: compare full 28-day windows before and after the change.
Sources
- Google - How Search Works: Rigorous Testing (2023)
- Search Engine Land - Google algorithm updates 2025 in review (2025)
- Backlinko - We Analyzed 4 Million Google Search Results (2025)