 RefreshRank
Content Decay vs Seasonality: How to Tell the Difference
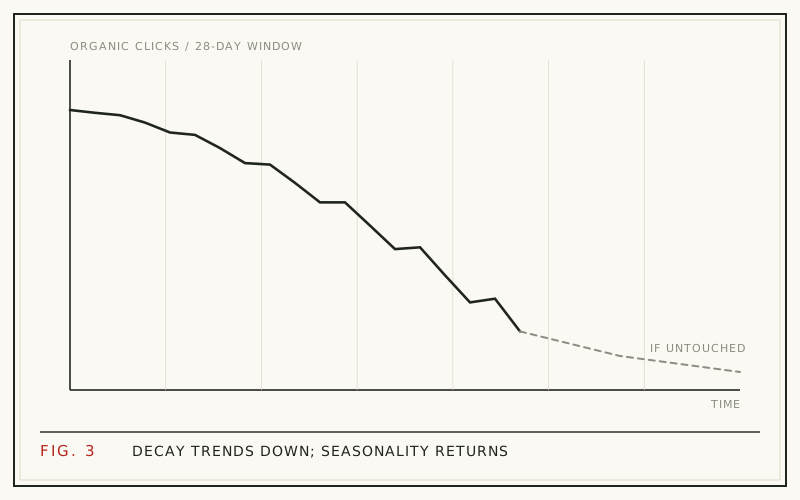
Here is the fastest test: compare this period's clicks with the same period last year in Google Search Console. Seasonality repeats - year-over-year numbers come out roughly flat even when the monthly graph dips. Decay trends - each window lands below the same window a year earlier, in season and out.
The two get confused because they look identical on a short graph: clicks going down. But they demand opposite responses. Seasonality asks for patience. Decay asks for action, because it compounds quietly while you wait for a recovery that is not coming.
This guide shows the year-over-year method in practice, why 28-day windows make it reliable, and what each pattern looks like in real data - including the tricky case where a page is both seasonal and decaying.
Two patterns, one symptom
Seasonality is demand moving. People search for tax software in March and gift guides in November; when the searches stop, your impressions and clicks fall no matter how well you rank. The page is fine - the audience left, and it will come back on schedule.
Decay is position and appeal eroding. Demand holds, but your page captures less of it: rankings slip, the snippet ages, competitors update, SERP features crowd in. The audience is still there - it is choosing someone else. We cover those mechanics fully in what is content decay.
Why the confusion is expensive
Misreading decay as seasonality means waiting through months of compounding losses for a rebound that never arrives. By the time the mistake is obvious, the page has slid further and part of your comparison history has aged out of Search Console.
Misreading seasonality as decay is costly in the other direction: you "fix" healthy pages, and unnecessary rewrites carry real risk, because a page that ranks can be made worse. The year-over-year test takes minutes per page and prevents both mistakes. Cheap check, expensive errors - always run the check.
The year-over-year method
The method is one comparison, repeated per page:
- Open the Search Console Performance report and filter to the page
- Set the date range to the most recent 28 days
- Compare against the same 28 days one year earlier
- Repeat for two or three earlier windows to confirm the direction
Seasonality cancels out in this comparison, because both windows sit at the same point in the annual cycle. Whatever difference remains is real change: flat or up means the page is healthy, while a consistent year-over-year decline across several windows means decay. One bad window proves nothing; three in a row is a trend. The exact click-path, filters, and exports are in our Search Console guide.
Why 28-day windows beat calendar months
Calendar months are unequal instruments: they run 28 to 31 days, contain different weekday mixes, and shift holidays around. A February-versus-January comparison is distorted before you start reading it.
A 28-day window always contains exactly four of each weekday, so weekly rhythm cancels out, and every window is the same length as every other. Search Console retains 16 months of data - enough for a full year-over-year comparison with a few windows to spare. That 16-month ceiling is also why waiting too long destroys evidence: the history you need for the comparison quietly expires.
What seasonality looks like
A seasonal page draws a wave: impressions swing widely across the year while average position stays roughly stable. A tax-deadline guide earns most of its annual clicks between January and April, flatlines all summer, and repeats the same shape the next year at similar heights.
The confirming signals: the dip's timing matches last year's dip, impressions fall in step with clicks, position holds through the trough, and year-over-year windows come out roughly even. Seasons also move whole topics together - if every holiday post on the site dips in February, that is a calendar, not a problem.
What decay looks like
A decaying page steps downward: each quarter a little below the last, with no recovering rhythm. Average position drifts from 3 to 5 to 8, CTR fades as the snippet ages against fresher competitors, and year-over-year windows come in consistently negative.
Decay is also selective. One post slides while its neighbors hold, because each page has its own SERP, its own competitors, and its own staleness clock. If the decline follows the page rather than the calendar, it is decay. If you are unsure which of the five common causes you have, run the full traffic-drop diagnostic first.
The tricky case: seasonal and decaying at once
The patterns combine. A gift-guide post can peak every November and still be decaying - the giveaway is lower highs. Each peak lands below the previous year's peak, and each off-season trough sits a little lower too.
This is exactly where year-over-year windows earn their keep: compare November against November, never November against September. If peak-season windows are shrinking year over year, refresh the post before its next season begins, so the update gets recrawled in time and pays off at full demand rather than in the dead months.
The signals, side by side
When you need a quick ruling, run down this table:
| Signal | Seasonality | Content decay |
|---|---|---|
| Monthly clicks | Dip and recover in cycles | Slide without recovering |
| Year-over-year clicks | Roughly flat | Consistently down |
| Impressions | Fall with demand | Often hold, then erode |
| Average position | Stable through the dip | Drifting downward |
| Scope | Whole topics move together | Page by page |
| Timing | Matches last year's calendar | Independent of the calendar |
Why catching decay early matters
Your aging winners are the asset base. Ahrefs found that 72.9% of pages ranking in Google's top 10 are more than three years old (Ahrefs, 2023) - mature pages are where rankings live. And traffic concentrates hard: a HubSpot study of roughly 20,000 blog posts found that about 1 in 10 posts generated 38% of total blog traffic (HubSpot, updated 2025). When one of those compounding winners starts decaying, a meaningful share of the whole site's traffic is on the line.
Freshness pressure is rising too: Ahrefs measured that URLs cited by AI assistants are on average 25.7% fresher than organic search results (Ahrefs, 2026). An aging page now loses visibility on two fronts at once - the classic SERP and the AI answer layer above it.
Confirm the diagnosis, then act
If the year-over-year windows show a season, do nothing except schedule refreshes for the pre-season window. If they show decay, prioritize the pages with the most traffic to win back and refresh them - title, meta description, intro, FAQ, dates - following the refresh playbook. Then verify the outcome with the same before-and-after windows, as covered in measuring refresh results.
Running these comparisons by hand across a whole site is the tedious part. The free RefreshRank plugin does the window math automatically: it syncs your own Search Console history daily, reads 16 months in 28-day windows, and gives every page a 0-100 decay score with a win-back Potential ranking. Detection is free on one site, and every proposed change is shown as a diff you approve or reject - nothing publishes on its own.
Questions
How much historical data do I need to separate decay from seasonality?
Ideally 13 months or more, so at least one full window can be compared against the same window a year earlier. Search Console keeps 16 months, which covers it with room to confirm the trend across several windows. With less than a year of history, you cannot cleanly cancel seasonality - lean on topic knowledge and impression trends instead.
What if my site is less than a year old?
You cannot run a true year-over-year test yet, so substitute two checks. Watch impressions: falling impressions with a stable position suggests demand is moving, which points to seasonality. And check Google Trends for the topic's annual shape. Also compare the page against similar-topic pages on your site - seasons move topics together, decay moves single pages.
Can an algorithm update look like seasonality?
It mimics decay more than seasonality - updates cause drops, not cycles. The separator is speed and breadth: updates hit many pages within days of a confirmed rollout date, while decay is gradual and staggered page by page. Our traffic-drop checklist covers ruling updates in or out before you settle on either diagnosis.
Do weekly patterns matter, or just annual ones?
Weekly rhythm is the more common trap. B2B content dips every weekend, so comparing a weekday-heavy range against a weekend-heavy one manufactures fake drops. That is the case for 28-day windows: four of each weekday, every time, so the weekly cycle cancels out and only real change remains in the comparison.
Are impressions or clicks better for spotting seasonality?
Impressions. They track search demand directly: when fewer people search, impressions fall even for a page ranking first. Clicks mix demand together with position and snippet appeal. A page whose impressions and clicks fall together in season, with stable position, is seasonal. Clicks falling while impressions hold points toward decay instead.
Should seasonal posts be refreshed too?
Yes, on a calendar. Refresh a seasonal post several weeks before its peak so Google recrawls it and the updated title and snippet are live when demand returns. A stale year in the title of a seasonal post is especially costly, since the entire year's traffic arrives in one compressed window.
How fast does decay usually show up?
It is topic-dependent: fast-moving subjects can slide within months of publication, while evergreen guides may hold for years. Most decay unfolds over quarters, which is why single-month comparisons mislead and multi-window trends are the standard of evidence. See how fast content decays for the published timelines.
Can I automate this comparison?
Yes. A spreadsheet of exported Search Console windows works, and the free RefreshRank plugin runs the comparison continuously - it syncs your own Search Console data daily and flags pages whose windows trend down once seasonality is accounted for. Automation matters mainly for catching decay early, before the losses compound and the history you need expires.
Sources
- Ahrefs - How Long Does It Take to Rank in Google? (2023)
- HubSpot - Compounding Posts Generate 38% of Your Blog's Traffic (updated 2025)
- Ahrefs - What Is Content Decay? And How to Fix It (2026)