 RefreshRank
How to Find Decaying Content in Google Search Console
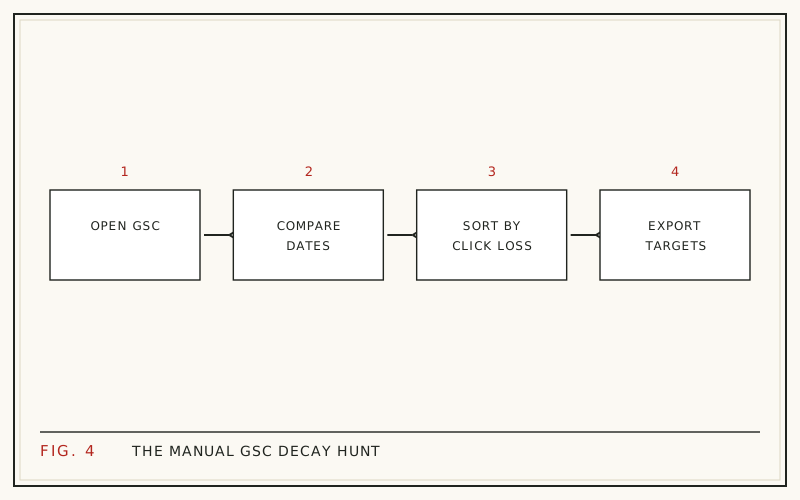
To find decaying content in Google Search Console, open the Performance report, compare the last 28 days against the same 28 days one year earlier, switch to the Pages tab, and sort by the click difference. The pages losing the most clicks are your decay candidates. Once you know where to click, the whole pass takes about 20 minutes.
It is worth doing because old posts carry most sites. HubSpot found that 76% of its monthly blog views came from posts published in earlier months (HubSpot, 2015), and staying ranked is the exception rather than the rule: in a Semrush study tracking 28,000 new domains for 13 months, only 4.2% kept at least one top-10 keyword for the entire period (Semrush, 2023).
This guide walks through the exact steps, the traps that make healthy pages look sick, and the honest limits of doing the whole thing by hand.
Why Search Console is the right tool for the job
Search Console shows what actually happened: real impressions, real clicks, and real average positions from Google's own logs. Third-party rank trackers estimate; Search Console records. For decay detection - the slow loss of clicks a page used to earn - that difference matters, because decay is measured against your own history, not against a keyword database.
It is also free, covers every query that ever showed your pages, and keeps 16 months of history. That window is exactly enough for one year-over-year comparison, which is the cleanest way to separate content decay from ordinary seasonal movement. Everything below happens inside the Performance report.
Step 1: Set up a year-over-year comparison
Open Search Console, choose Performance -> Search results, and click the date filter at the top. Select the Compare tab, then Custom, and set two matching 28-day windows: the most recent 28 days and the same 28 days one year earlier.
Two details matter here. Use 28 days rather than a calendar month so both windows contain exactly four of each weekday - otherwise a window with an extra weekend skews the totals, especially on B2B topics. And compare year over year rather than month over month so seasonal swings cancel out. A ski-gear post is supposed to drop in April; comparing April to April keeps that from looking like decay. If your site is younger than 13 months, compare consecutive 28-day windows instead and read the results with seasonality in mind.
Step 2: Sort the Pages tab by lost clicks
Switch from Queries to the Pages tab. You now see every URL with its clicks in both windows, plus the difference between them. Click the click-difference column so the biggest losers rise to the top.
Ignore dramatic percentage swings on tiny numbers - a page that fell from 6 clicks to 2 is noise, not a finding. You are looking for pages that lost meaningful absolute traffic: the post that earned 900 clicks in last year's window and 400 in this year's. Note the top ten or so declining URLs; that is a workable shortlist for one month of refresh work.
Step 3: Read position and CTR for each decliner
Make sure all four metric tiles are enabled - clicks, impressions, CTR, and average position - then look at each declining page. The combination tells you what kind of problem you have.
- Position fell and clicks fell: a genuine ranking loss. Competitors or SERP changes overtook the page.
- Position held but CTR fell: the snippet stopped earning the click - often an aging title, a stale date, or a more crowded results page.
- Impressions fell across the board: demand for the topic itself may be shrinking, which no refresh will fix.
Each pattern points to a different fix, so record which one applies next to each URL on your shortlist.
Step 4: Drill into the queries behind the drop
Click a declining page to filter the whole report to it, then switch to the Queries tab with the same comparison still active. Sort by click difference again. Now you can see exactly which searches stopped sending traffic.
This is the most useful step in the workflow. If the lost queries are still on topic, the page has slipped for searches it should own, and a refresh can target exactly those terms. If the lost queries drifted off topic, Google has re-interpreted the page, and the fix is sharper focus rather than fresher content. Either way, write the top three to five lost queries next to the URL - they define the scope of the rewrite.
Step 5: Export and build a shortlist
Use the Export button at the top right to pull the page-level comparison into Google Sheets or Excel. Add two computed columns: absolute click loss and percentage loss. Then score each page roughly on what it could realistically win back - a page that lost 500 monthly clicks from position 8 is worth more attention than one that lost 50 from position 45, even if the percentages say otherwise.
Sort by that judgment, not by percentage alone, and carry the top handful into your editorial calendar. A fuller method for ranking the queue is in our guide to prioritizing content updates.
Rule out the causes that are not decay
Before refreshing anything, check your shortlist against causes that look like decay but are not.
- Algorithm updates: if many unrelated pages dropped in the same week, compare the drop dates against confirmed Google updates. Background movement never stops - Google ran 719,326 search quality tests in 2023 and launched 4,781 changes from them (Google, 2023) - but the named updates are the waves big enough to explain site-wide shifts.
- Technical issues: redirects, accidental noindex tags, or URL changes make a page's clicks vanish from its old address.
- Cannibalization: a newer post on your own site may have taken the queries. Check whether another URL gained what this one lost.
- Seasonality: mostly neutralized by year-over-year windows, but double-check event-driven topics.
The full diagnostic tree is in our traffic-drop checklist.
The honest limits of the manual workflow
Search Console keeps 16 months of data. That is enough for exactly one year-over-year comparison, and pages that started decaying more than a year ago have already lost their healthy baseline - you cannot see how good they once were. The interface also shows at most 1,000 rows per table, and everything you found this month goes stale next month.
None of this makes the workflow wrong. It makes it a recurring chore: 20 to 30 minutes a month for one site, multiplied by every site you manage, with a spreadsheet that starts rotting the day you export it.
Automating this exact workflow
This detection loop is the thing RefreshRank was built to automate. The plugin connects to your site's own Search Console property, syncs up to 16 months of history daily, and compares 28-day windows for every page - the same comparison you just did by hand. Each page gets a decay score from 0 to 100 and a win-back Potential estimate, and the queue is sorted so the biggest recoverable losses sit on top.
Detection is free on one site, permanently, with no card and no signup form: install the plugin from wordpress.org and connect Search Console. It finds the pages; deciding what to change stays your call. Setup steps are in the getting started guide.
From shortlist to recovery
A decay list only pays off when you act on it, and refreshing old content has an unusually strong track record: when HubSpot systematically updated older posts, organic search views of those posts rose by an average of 106% (HubSpot, 2015).
Start with the highest-potential page. Refresh the elements the lost queries point at - usually the title, the meta description, the introduction, and any dated facts - then re-run the same 28-day comparison a month or two later to see whether the line bent. The step-by-step process is covered in how to refresh old blog posts.
Questions
How often should I check Search Console for decaying content?
Monthly is enough for most sites. Decay is a slow pattern best measured across 28-day windows, so weekly checks mostly show noise. Put a recurring 20-minute block on the calendar, re-run the same year-over-year comparison, and update your shortlist. High-volume publishers with hundreds of posts may want to check every two weeks or automate the monitoring entirely.
How much history does Google Search Console keep?
Sixteen months. That is enough for one clean year-over-year comparison, but nothing more - you cannot see a page's performance from two or three years ago. If you want a longer baseline, export your data regularly or use a tool that stores history as it syncs. The 16-month cap is also why decay that began long ago can be invisible in the interface.
Should I look at clicks or impressions to spot decay?
Start with clicks, because clicks are the traffic you actually lost. Then use impressions to interpret the loss: falling clicks with steady impressions point to a snippet or ranking problem you can fix, while falling clicks alongside falling impressions can mean demand for the topic itself is shrinking. A refresh helps the first case far more than the second.
Why compare 28-day windows instead of calendar months?
Calendar months have different lengths and different weekday mixes - a month with five Saturdays reads very differently for business topics than one with four. Two 28-day windows each contain exactly four of every weekday, so the comparison is clean. It is the same reason a 28-day option sits in Search Console's own date picker.
What counts as a significant traffic decline for one page?
Judge absolute and relative loss together. A workable rule: at least 20-30% fewer clicks year over year, and enough absolute volume that recovery matters - say 50 or more lost clicks per month. Below that, normal ranking churn and noise dominate. Also require the decline to persist across a full 28-day window rather than reacting to one bad week.
My site is under a year old. Can I still find decay?
You cannot run a true year-over-year comparison yet, so compare consecutive 28-day windows instead and be careful about seasonality - a summer dip on a seasonal topic is not decay. In practice, very young sites rarely have real decay because rankings are still settling. Focus on building coverage first, and start decay monitoring once 13 months of history exist.
Does Search Console data match Google Analytics?
No, and it should not. Search Console counts clicks from Google search results; Analytics counts sessions after the page loads, filtered by consent banners and blockers. The numbers always differ. For decay detection, use Search Console alone - it isolates organic Google traffic, which is where decay happens, and it is unaffected by tracking consent.
Can Search Console tell me why a page dropped?
Not directly - it reports what happened, never why. But the metric combinations narrow it down: position down means a ranking loss, CTR down at stable position means a snippet problem, impressions down means shrinking or re-routed demand. Cross-reference the drop date with confirmed algorithm updates and your own site changes to close the loop.
Sources
- HubSpot - Optimizing the Past (2015)
- Semrush - How Long Does It Take to Rank Higher on Google (2023)
- Google - How Search Works: Rigorous Testing (2023)