 RefreshRank
Client Reporting From Google Search Console: A Practical Guide
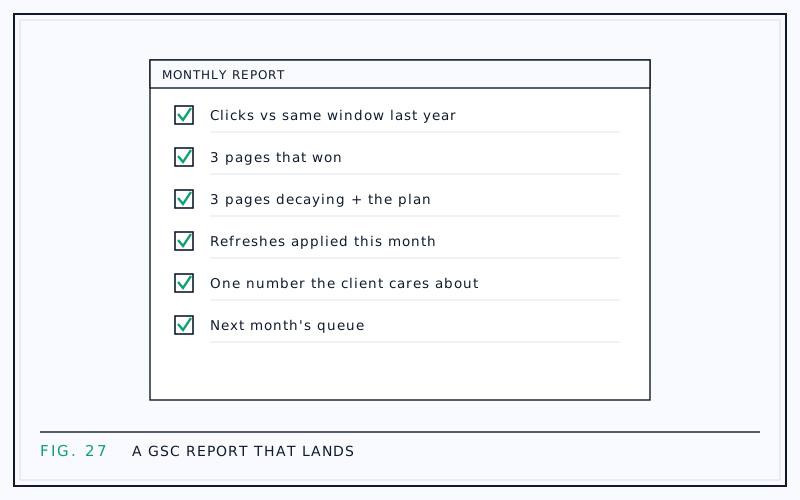
A useful Search Console client report comes down to four numbers - clicks, impressions, click-through rate, and average position - compared over honest date ranges, plus a few sentences of plain-language interpretation. That is the whole skeleton. Most of what makes reporting slow to build and hard to read is everything agencies add on top of it.
This guide covers which metrics earn a place, how to choose comparison windows that do not mislead, what to leave out entirely, and how to keep the whole exercise under an hour per client without it looking thin.
What a client report is actually for
A report has two jobs: help the client make decisions, and sustain their confidence that the retainer is money well spent. It is not a work log, and it is not a place to demonstrate effort through page count. Nobody has ever renewed a contract because the deck was long.
That reframing simplifies everything downstream. Every element earns its place by answering a client question - is this working, what changed, what happens next - or it goes. The related discipline of proving SEO value with the client's own data starts from the same premise: measured beats impressive, every month.
The four Search Console metrics and what they mean
Everything in the Performance report reduces to four metrics:
- Clicks: how many times searchers clicked through to the site - the headline number, closest to business outcomes
- Impressions: how many times the site appeared in results - visibility, not visits
- CTR: clicks divided by impressions - how compelling the listing looks when it does appear
- Average position: where the site ranked when it appeared, weighted by impressions - useful, and the easiest to misread
Clients need these definitions once, in plain words, in the first report; after that the labels can stand alone. Position deserves special care before it goes anywhere near a client - what a dropping average position means walks through the traps.
Choose date ranges that tell the truth
Comparison windows quietly decide what story the numbers tell, so pick them deliberately. Two rules cover most cases. First, compare equal 28-day windows rather than calendar months: months have different lengths and different weekday mixes, and 28 days keeps weekends balanced on both sides. Second, for any business with seasonal demand, add a year-over-year comparison of the same window, which Search Console's 16 months of history makes possible.
Skipping the year-over-year check is how agencies end up taking credit for December or blame for July. Content decay versus seasonality covers how to tell a real decline from a calendar effect before either one reaches a client report.
Leave the vanity metrics out
Some numbers make reports longer and trust shorter:
- Total keywords ranking: rises and falls with tool database changes and means little on its own
- Impressions growth presented alone: visibility without clicks invites the question you cannot answer
- Sitewide average position: one number summarizing thousands of queries hides everything that matters
- Tool-branded scores: any metric a client cannot act on or independently verify
- Screenshots of dashboards: data without interpretation is homework, not reporting
The test for every number is blunt: can the client do something with it, or does it exist to look like progress? Cutting these is also the fastest way to shorten build time, because vanity metrics are the slowest part to assemble and explain.
A one-page report skeleton
| Section | Contents | Size |
|---|---|---|
| Headline | The month in one or two sentences | 2 lines |
| Trend | Clicks vs the prior 28 days and vs last year | 1 chart |
| Wins | What you shipped and what recovered | 2-3 bullets |
| Watch list | What is declining and the planned response | 2-3 bullets |
| Next | What you will do before the next report | 2-3 bullets |
One page is a feature, not a compromise. A client who reads the whole report every month retains more than one who skims a twenty-page deck quarterly, and the fixed structure means readers know where to look by the third month. Anything deeper - full audits, page-level appendices - belongs in a separate audit deliverable with its own cadence and its own price.
Report the work, not just the weather
Organic numbers move for reasons that have nothing to do with you: algorithm updates, seasonality, a competitor shipping something good. A report that only shows metrics makes you accountable for the weather. Pairing every metric with the action you took makes you accountable for work, which is the accountability you can actually survive.
Content maintenance is a reliable source of reportable action, because the stakes are structural. HubSpot's analysis of its own blog found 76% of monthly blog views came from posts published in earlier months (analysis first published 2015). Older pages carry the load on most sites, so refreshing them is visible, recurring, and easy to evidence - measuring refresh results shows the before-and-after format that drops straight into the wins section.
Explaining average position without jargon
Average position is impression-weighted, which produces honest-looking numbers that mislead. The classic case: a site starts appearing for many new queries down at position 40 or so. Average position gets worse while impressions and even clicks improve - the site is growing, and the summary number says it is sinking.
The plain-language script for clients: position is where you appeared when you appeared, so showing up for more searches can pull the average down even as traffic rises. Report position per page or per query group, never as one sitewide figure, and always place it next to clicks so the pair gets read together. If a client fixates on position alone, that is a sign the earlier definitions did not land - reteach them before the next report, not during a dispute.
Keep reporting under an hour
Speed is a solved problem at most agencies. AgencyAnalytics' 2026 benchmarks survey of 494 agency professionals found 73% complete a client report in under an hour, and 46% in under 30 minutes. If reporting eats your week, the template is the problem, not the effort.
What gets reporting under the hour: a fixed skeleton reused every month, comparison windows that never change between reports, and automation for the data pull so human time goes into the interpretation sentences - the only part clients actually value. The hour also has to include thinking time, which is another argument for fewer numbers: five metrics you can explain beat twenty you can only display.
Delivery: PDF, email, or live link
Format matters less than consistency, but each option has trade-offs. PDFs are portable and get forwarded to bosses, which is where renewal decisions happen. Email summaries get read fastest. Live dashboards impress in meetings and then go unvisited between them. A one-page PDF plus a three-sentence email covering the headline is a defensible default for most retainers.
If reports should carry your agency's brand rather than a tool's, white-label SEO reports covers the options. For what it is worth, RefreshRank's Agency plan includes white-label client reports - your brand name, logo, and accent color - delivered as public share links that expire after 30 days and need no client login, which suits clients who will not create yet another account.
Reporting mistakes that cost renewals
The relationship-enders are behavioral, not technical:
- Changing metrics month to month, which reads as hiding something even when it is not
- Sitting on bad news until the client discovers it themselves
- Jargon without translation - quiet confusion curdles into distrust
- Reports that never state what happens next
- Skipping months when results are flat
The stakes are long-term by default: the same AgencyAnalytics 2026 survey found 62% of agency clients stay two years or more. Relationships of that length are built on dozens of small, honest reports, and they can be ended by a few evasive ones. The report is not paperwork around the work - over a multi-year retainer, it is most of what the client ever sees of you.
Questions
How often should agencies send SEO reports?
Monthly is the standard cadence and matches how most retainers bill. More frequent reporting rarely adds signal, because organic data is noisy week to week; less frequent leaves clients guessing between touchpoints. Whatever cadence you pick, keep it fixed - a skipped report reads as a hidden one.
Which Search Console report should client numbers come from?
The Performance report. It holds clicks, impressions, CTR, and average position, filterable by page, query, country, and device, with a comparison mode for date ranges. Indexing and coverage reports are diagnostic tools for your own workflow; they only belong in a client report when something there needs action or explanation.
How far back does Search Console data go?
Google keeps 16 months of performance data in Search Console. That is enough for a year-over-year comparison with margin to spare, but history beyond that horizon disappears - so if you want longer baselines, export or sync the data regularly from the start of the engagement.
Should client reports include Google Analytics data too?
Often, but keep the jobs separate: Search Console explains how people found the site in Google; analytics explains what they did after arriving. For an SEO-focused report, Search Console carries the core story, with analytics adding conversion context where the client genuinely cares about it.
What is a good click-through rate to report?
There is no useful universal number - CTR depends heavily on position, query type, and how many ads and features crowd the results page. The honest benchmark is the page's own history: compare each page's CTR against its past at a similar position, and investigate the ones that slipped.
Why did average position drop while clicks went up?
Usually because the site started appearing for new queries that rank lower down. Those new impressions drag the average position down even while total clicks grow. It is typically a sign of expanding visibility, not decline - which is why position should never be reported as a single sitewide number.
Do clients need their own Search Console access?
They should have it. The property ideally belongs to the client, with the agency added as a user - that preserves continuity if the relationship ends and signals transparency while it lasts. Few clients will ever look at it, but knowing they could is part of what makes your reports credible.
What does white-label reporting mean?
Reports that carry the agency's brand - name, logo, colors - rather than the brand of the tool that produced them. The client sees one consistent identity for both the work and the reporting. Some tools support this natively; RefreshRank's Agency plan does, with shareable report links that require no client login.
Sources
- AgencyAnalytics - 2026 Marketing Agency Benchmarks Report (2026)
- HubSpot - Optimizing the Past (2015)