 RefreshRank
How Fast Does Content Decay? Timelines From Real Studies
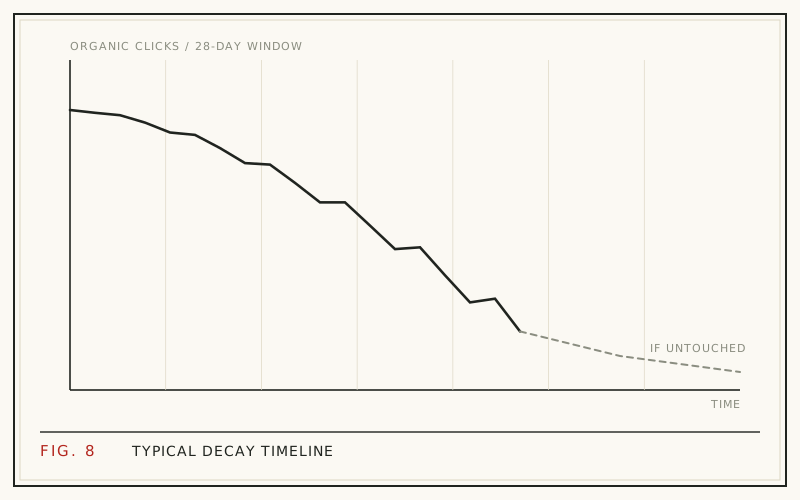
There is no single decay rate, and anyone quoting one is guessing. What the published research supports is a shape: most pages climb for a few months, hold a plateau for somewhere between several months and a couple of years, then slide gradually rather than crash. Semrush tracked 28,000 new domains for 13 months and found only 4.2% kept at least one top-ten keyword for the whole period (Semrush, 2023). Holding a ranking is the exception, not the default.
Speed depends almost entirely on the topic. A news post can be finished in a week. A definition page can hold for five years. Between those extremes sit the posts most blogs actually depend on.
Below: what the longevity studies show, which content types fade fastest, and how to measure the decay rate on your own site instead of borrowing someone else's number.
What does the ranking-longevity data actually show?
Rankings churn far more than most site owners assume. In Semrush's study of 28,000 newly registered domains tracked from July 2021 to July 2022, only 4.2% held at least one top-ten keyword across all 13 months, and among domains that did reach the top ten, only 27% were still there at the end of the study (Semrush, 2023).
That is a study of new domains, so it overstates the difficulty for an established site. But the direction is the point. Top-ten positions are rented. Most pages that get there lose the spot inside a year, and nothing dramatic has to happen for that to occur.
The useful reading is not a percentage to memorize. It is that decline is the normal state of an untended page, and holding position is an active result rather than a passive one.
How long does a new post take to reach its peak?
Longer than most publishing calendars assume, which matters because the climb sets the clock for everything after it. Ahrefs found only 1.74% of newly published pages reach the top ten within a year (Ahrefs, 2023). Most pages never get high enough to have much to lose.
For pages that do climb, the pattern is a ramp of roughly three to six months, then a plateau. Treat that as a working rule of thumb rather than a measured constant, because it varies with competition and site authority.
The practical consequence: judging a post's health at week six tells you almost nothing. Decay analysis only becomes meaningful once a page has established a baseline, which is why comparisons against the same window a year earlier are the workhorse measurement.
Is there such a thing as a content half-life?
Half-life is a borrowed metaphor, and it is useful right up to the point where you try to make it precise. In physics, decay is constant and predictable. In search, a page can hold flat for two years and then lose half its clicks in a single quarter because one competitor published something better.
What the metaphor gets right is the compounding. A page shedding a small share of clicks each month is not losing much in any one window, but the losses stack, and a year of quiet slippage is severe.
What it gets wrong is inevitability. Decay is not intrinsic to a page. It is the result of specific outside changes, which is exactly why a specific update can reverse it. Start with the mechanics of content decay if the causes are the part you want.
Which content types decay fastest?
Decay speed tracks how quickly the correct answer changes. Sort your library by that and the pattern is obvious:
| Content type | Decay speed | What usually triggers it |
|---|---|---|
| News and event coverage | Fastest | The query itself moves on |
| Software tutorials with screenshots | Fast | The interface ships changes |
| Product roundups and comparisons | Fast | New models, new prices |
| Statistics and benchmark posts | Moderate | The figures visibly age |
| Strategy and opinion pieces | Moderate | Practice shifts, rivals publish |
| Definitions and durable how-tos | Slowest | Competitor updates, SERP features |
These are qualitative bands, not measured rates. Their value is in triage: a screenshot-heavy tutorial deserves a look every few months, while a definition page can sit unexamined for a year without much risk.
What holds up for years?
A small set of pages does the opposite of decaying. HubSpot's analysis of around 20,000 posts found that compounding posts, roughly one in ten, generated 38% of total blog traffic (HubSpot, updated 2025). Those pages grow month after month long after publication.
Compounding posts share traits: broad and durable search demand, an answer that does not expire, and enough coverage that searchers stop looking after reading. They are also the pages that hurt most when they finally turn, because they carry so much of the total.
So the goal is not preventing decay everywhere. It is knowing which handful of pages carry your traffic and watching those closely, which is the argument in how to prioritize content updates.
Slow slide or sudden drop: what is the difference?
The two have different causes and different fixes, and the shape of the curve tells you which you are looking at.
A slow slide is decay: one page, or a scattered handful, losing clicks gradually across several 28-day windows while the rest of the site is fine. Competitors improved, the results page changed, your snippet aged.
A sudden drop is something else. Sitewide losses inside a few days usually mean an algorithm update, a technical fault, an accidental noindex, or a tracking change. Refreshing content will not fix any of those, so diagnose before you write. Cyclical dips that return every year are a third case entirely, covered in content decay vs seasonality.
Why your site's decay rate is the only one that matters
Published averages are useful for calibration and useless for decisions. They pool wildly different niches, site sizes, and link profiles, and none of them knows what your competitors published last quarter.
Your own history answers the question directly. Take your twenty highest-traffic pages, compare their clicks now against the same period a year ago, and you have a decay rate that is actually about you. Do it twice and you have a trend.
That number will surprise you in both directions. Some pages you assumed were dying are flat, and some you never think about have quietly lost most of their traffic. Assumption is the expensive part.
How do you measure decay on your own site?
Google Search Console holds 16 months of performance history, which is enough for one clean year-over-year comparison per page. Use trailing 28-day windows rather than calendar months, because a 28-day window always contains the same number of each weekday and will not distort a comparison the way a short February does.
For each significant page, record clicks, impressions, average position, and CTR for the latest window, the previous window, and the matching window last year. Falling clicks with steady position points at the snippet. Falling position points at the content.
The manual version is in finding decaying content in Search Console. The free RefreshRank plugin does the same window math automatically against your site's own Search Console data, scoring each page's decay from 0 to 100 and sorting the queue by win-back potential, free on one site.
When should you step in?
Not at the first bad window. Search Console data is noisy, and a single soft month tells you very little. The threshold most teams settle on is two or three consecutive declining windows on a page that still matters, confirmed against the same period last year so seasonality is ruled out.
Urgency should follow the size of the loss, not the size of the percentage. A page down 40% from a hundred clicks a month is a rounding error. A page down 15% from four thousand is your next afternoon's work.
The pages worth acting on share a profile: real traffic history, a topic that still has demand, and a gap you can actually close.
What a realistic refresh cadence looks like
Decay speed should set your review rhythm, not the calendar. A schedule that survives contact with a normal week looks roughly like this:
- Monthly: scan the decay queue and check your top twenty pages for two-window declines
- Quarterly: review anything screenshot-heavy or price-related, whether or not it has dropped yet
- Twice a year: audit evergreen pillar pages for facts, links, and coverage gaps
- On trigger: refresh immediately when a product changes, a rule changes, or a rival takes your position
One caveat about measurement. Recovery after a refresh is rarely instant; Google has to recrawl, reassess, and gather fresh behavioral data, so give a change several weeks before you judge it. The method for that is in measuring content refresh results, and the audit itself takes about twenty minutes with the decay audit checklist.
Questions
How fast does content decay on average?
There is no reliable average, and the widely quoted weekly decay percentages do not trace back to real studies. What is measurable is longevity: Semrush found only 4.2% of 28,000 tracked domains held a top-ten keyword for 13 straight months (Semrush, 2023). Decay speed depends far more on your topic than on any general rate.
What is a content half-life?
It is a metaphor for how long a post takes to lose half its peak traffic. The idea is helpful for thinking about compounding losses, but it implies a steady, predictable decline that search does not produce. Real pages often hold flat for a long time, then drop sharply when a competitor publishes something better.
How long does a new blog post take to rank?
Longer than most plans assume. Ahrefs found only 1.74% of newly published pages reach the top ten within a year (Ahrefs, 2023). Pages that do succeed typically climb over three to six months before settling. Judging a post's performance in its first weeks tells you almost nothing useful.
Do all posts decay eventually?
Most competing pages do if nobody maintains them, because the environment keeps changing while the page stands still. A minority compound instead, growing for years. The difference is rarely the publish date and almost always whether the page has been kept accurate, well covered, and competitive with what now ranks.
How often should I check for content decay?
Monthly is enough for most sites, using trailing 28-day windows. Check your top twenty pages every month and the full library quarterly. Anything faster is mostly noise, since Search Console data fluctuates week to week and a single soft window rarely justifies rewriting anything.
Which posts decay fastest?
Anything whose correct answer changes on a schedule. News, product roundups, pricing comparisons, and software tutorials with screenshots age quickest, because the interface, the lineup, or the price moves without you. Definitions, historical explanations, and durable how-tos hold longest, often for several years before they need real work.
Can a post decay while impressions stay flat?
Yes, and it is a common pattern. Steady impressions with falling clicks means people still see your listing and choose someone else's. That points at the title, description, or visible date rather than the body content, so the fix is usually a snippet rewrite rather than a rewrite of the whole page.
How long until a refresh shows results?
Plan on several weeks, not days. Google has to recrawl the page, reassess it against the current results, and collect enough user behavior to act on. Compare the 28-day window after the change against the equivalent window before it, and note the refresh date so later comparisons stay honest.
Sources
- Semrush - How Long Does It Take to Rank Higher on Google? (2023)
- Ahrefs - How Long Does It Take to Rank in Google? (2023)
- HubSpot - Compounding Posts Generate 38% of Your Blog's Traffic (updated 2025)